
Which DI Stocks Have the Most Cash?
February 28, 2025 | Explore how much cash AAII Dividend Investing portfolio stocks hold, why it matters for dividend safety, and get the latest earnings and dividend updates from Nike, EOG Resources,

Some companies stockpile cash—like Berkshire Hathaway Inc.’s (BRK.B) $330.8 billion war chest—while others deploy it. This week, we look at how much cash and short-term investments each Dividend Investing (DI) model portfolio stock has. Then, we look at this week’s earnings reports.
Let’s start with this week’s deets:
Nike Inc. (NKE) has the largest proportionate allocation to cash and short-term investments among all DI companies. It also has good Dividend Grades.
EOG Resources Inc. (EOG) and J. M. Smucker Co. (SJM) both reported positive earnings surprises, while Home Depot Inc. (HD) was in line with expectations. Home Depot also raised its dividend, though the increase was small.
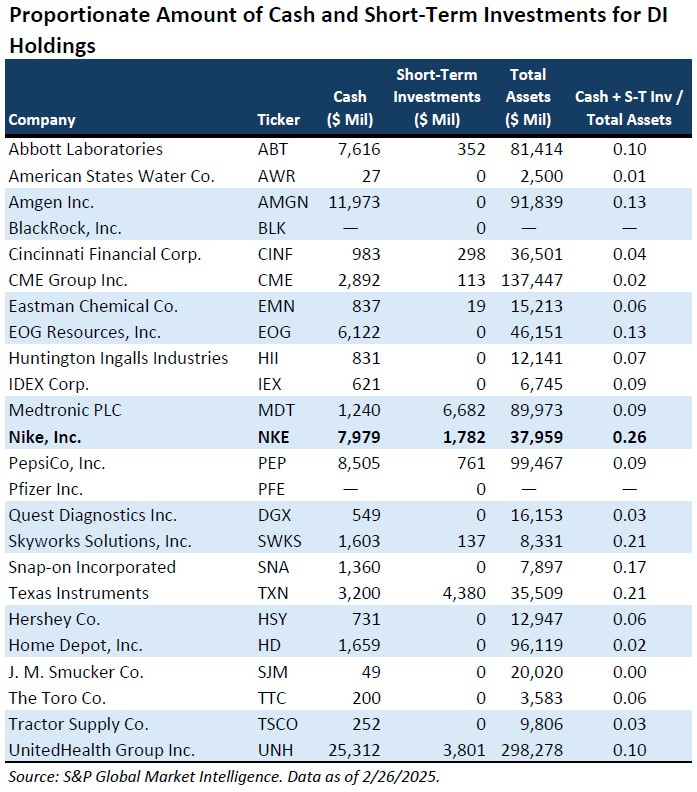
The Cash Holdings of DI’s Dividend-Paying Stocks
The amount of cash on a company’s balance sheet is important to dividend-seeking investors. We want there to be enough cash to fund the quarterly payouts. However, too much cash can be a drag on profitability.
There isn’t a magic number to seek out. Cash needs differ by company. For example, Huntington Ingalls Industries Inc. (HII) needs more capital than Quest Diagnostics Inc. (DGX) because of its business model. Huntington Ingalls Industries makes military ships while Quest Diagnostics does medical testing. The former operates in a more capital-intensive business.
Still, I thought it would be interesting to look at the companies held within the DI model portfolio by how much they have allocated to cash and short-term investments. Short-term investments are those with a maturity of one year or less.
I used the same metric for this analysis that I used in writing yesterday’s Investor Update about Berkshire Hathaway: the sum of cash and short-term investments relative to total assets. Total assets provide a common denominator to base comparisons on. (I purposely avoided using equity because it is affected by decisions regarding debt.)
Nike holds the largest allocation of cash and short-term investments. Combined, they accounted for 26% of the company’s total assets as of November 2024. Nike also has one of the largest cash balances in the model portfolio at nearly $8 billion. Only Amgen Inc. (AMGN), PepsiCo Inc. (PEP) and UnitedHealth Group Inc. (UNH) have higher absolute amounts of cash—and all three have more total assets than Nike, too.
Cash and short-term investments account for 9% of total assets for the average DI company. The DI strategy is more concerned with whether the model portfolio’s companies have the cash flow to cover the dividend than with the proportionate amount of cash and short-term investments they have on their balance sheets. The Dividend Grades will spot any potential problems in this area.
Nike’s Strong Dividend Grades
Nike is a well-known company worldwide. Its primary line of business is athletic footwear, though the company also sells sports apparel and various sports-related equipment. The company’s brands are Nike, Jordan and Converse.
Nike’s revenues fell 9% during the first six months of fiscal-year 2025. Earnings per share are down 25%. Elliott Hill returned as CEO last year and is in the process of revamping the company’s strategy and processes. According to the S&P Global consensus estimate, analysts anticipate earnings to be down for all of fiscal-year 2025 before rebounding in fiscal-year 2026 and fiscal-year 2027. (Nike operates on a June-to-May fiscal year.)
Dividend investors have priced the earnings decline into the stock price. The current dividend yield of 2.0% is well above Nike’s five-year average high of 1.5%. This differential is why Nike has a Dividend Valuation Grade of A (deep value).
The five-year dividend growth rate is 11.0%. Though November 2024’s 8.3% increase was the company’s smallest dividend hike in over a decade, it was still good on an absolute basis. Nike’s Dividend Growth Grade is nonetheless B (strong) because of the decline in cash flow from operations. Cash flow from operations has been dragged down by lower earnings. We’ll be looking for this trend to be reversed as Hill’s initiatives take hold.
The stock’s Dividend Strength Grade is B (strong). The earnings payout is the weak spot here due to the decline in profitability. Nonetheless, Nike has a very strong times interest earned ratio (21.5), a reasonable amount of debt and a history of not cutting its dividend.
Nike is also on the DI Ideas list. Stocks on this list pass the quantitative filters for consideration for the actual DI portfolio.
Dividend Pillars for NKE
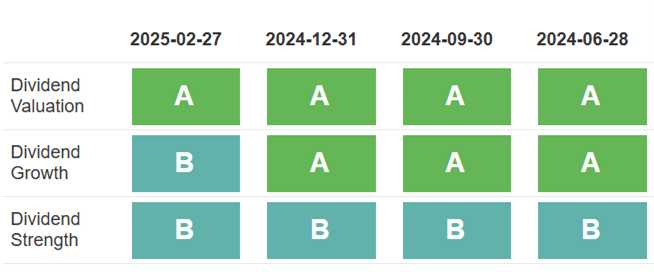
Data as of 2/28/2025.
Earnings News
EOG Resources gushed up a 6.6% positive surprise with fourth-quarter adjusted earnings of $2.74 per share. Though oil volumes were up year over year, the price of oil fell. This led to a decrease in year-over-year earnings.
Home Depot became the seventh company in the DI model portfolio to report earnings that were in line with analysts’ expectations. Comparable sales rose 0.8%, the first increase in two years. The company’s fiscal-year 2025 (ending January 31, 2026) guidance for adjusted earnings equates to $14.93 per share. This is below the S&P Global consensus estimate of $15.14 per share. Operating margins are forecast to decline in fiscal 2025 because of last year’s acquisition of specialty trade distribution company SRS Distribution Inc.
J.M. Smucker gave shareholders a tasty positive surprise with its adjusted earnings of $2.61 per share. Earnings were 10.1% better than the S&P Global consensus estimate. Though sales declined, gross margins widened. The $10.00 per share midpoint of J.M. Smucker’s raised adjusted earnings guidance for fiscal-year 2025 ending in April is above analysts’ expectations for $9.89 per share.
This week’s earnings improve the DI model portfolio’s fourth-quarter earnings scoreboard to 15 positive surprises, one negative surprise and seven in-line reports.
The Toro Co. (TTC) will announce its results on Thursday, March 6, and bring an end to the model portfolio’s fourth-quarter earnings season.
A Small Dividend Increase by Home Depot
The Home Depot raised its dividend by 2.2% to $2.30 per share. This is the smallest percentage increase since company started its current 15-year dividend hike streak in 2009. The current yield of 2.3% is below Home Depot’s five-year average high of 3.2% and implies a low valuation. The new dividend is payable on March 27.
 | A guest post by
|